Managed Grafana
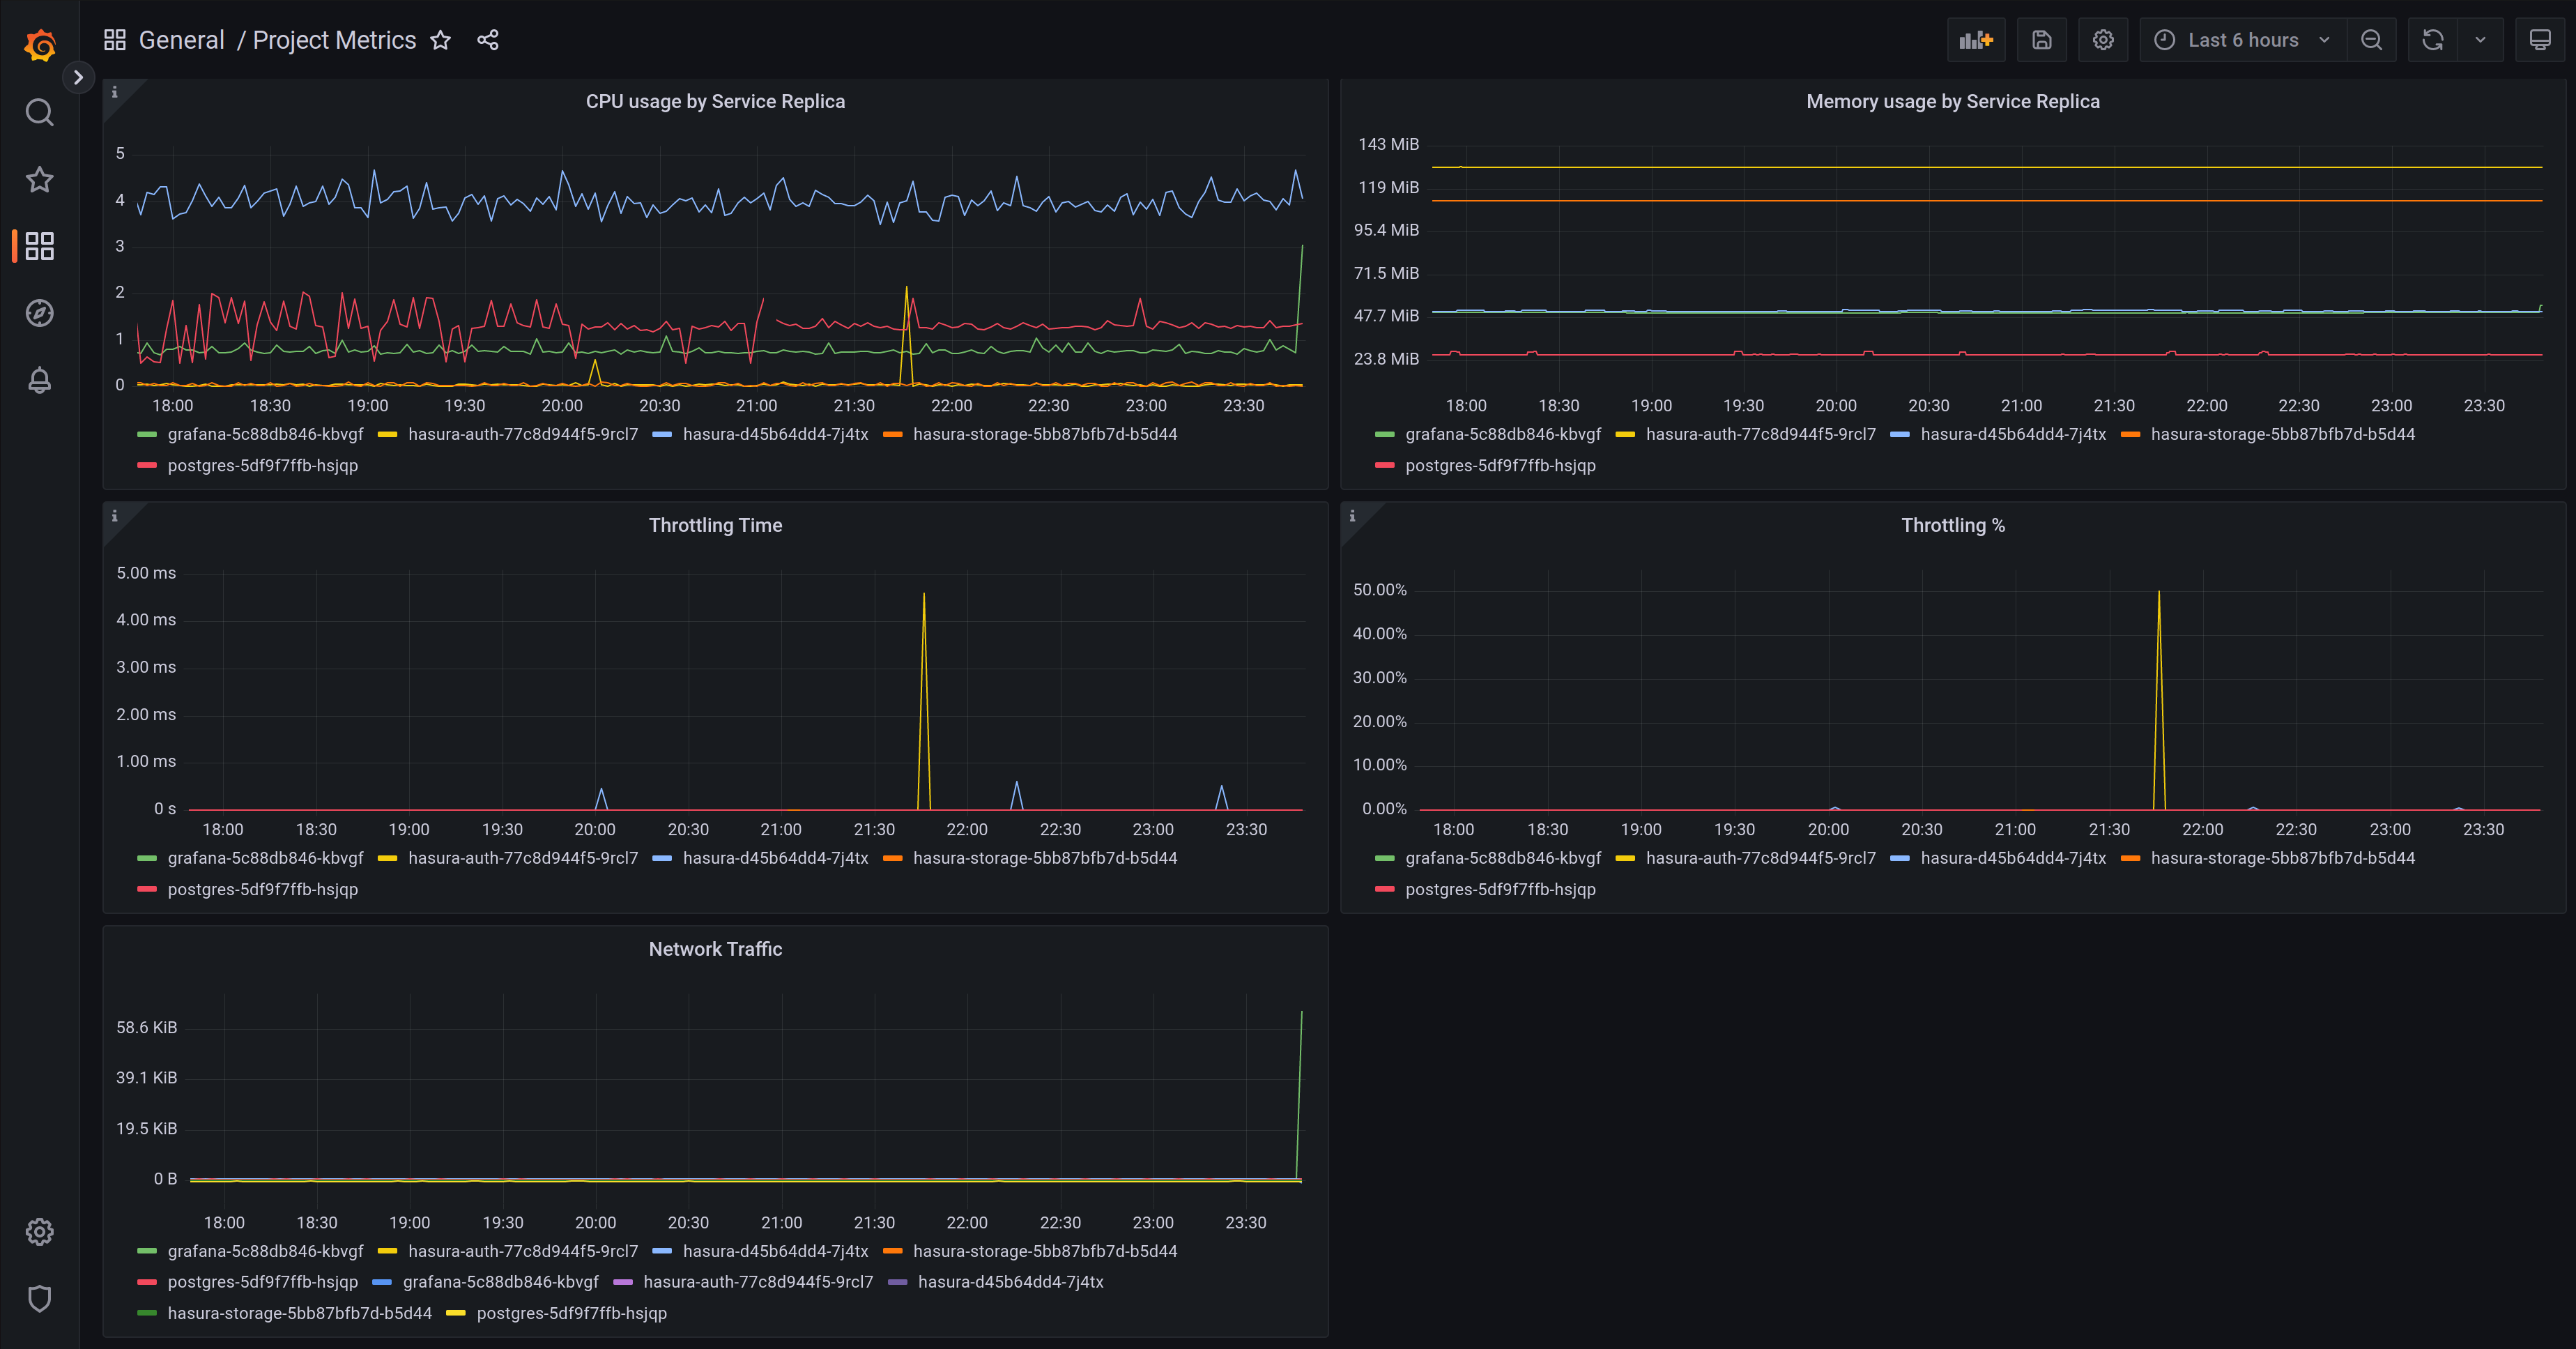
Your Grafana instance comes pre-defined with dashboards that cover backend services, functions, and networking:- vCPU/memory usage by Service replica for all services
- Throttling time / percentage
- Postgres volume usage
- Networking errors
- Functions metrics like calls, response times, errors
- and others, we keep adding new metrics and dashboards
Nhost Dashboard
You can find the link to Grafana in your project’s dashboard, under Metrics.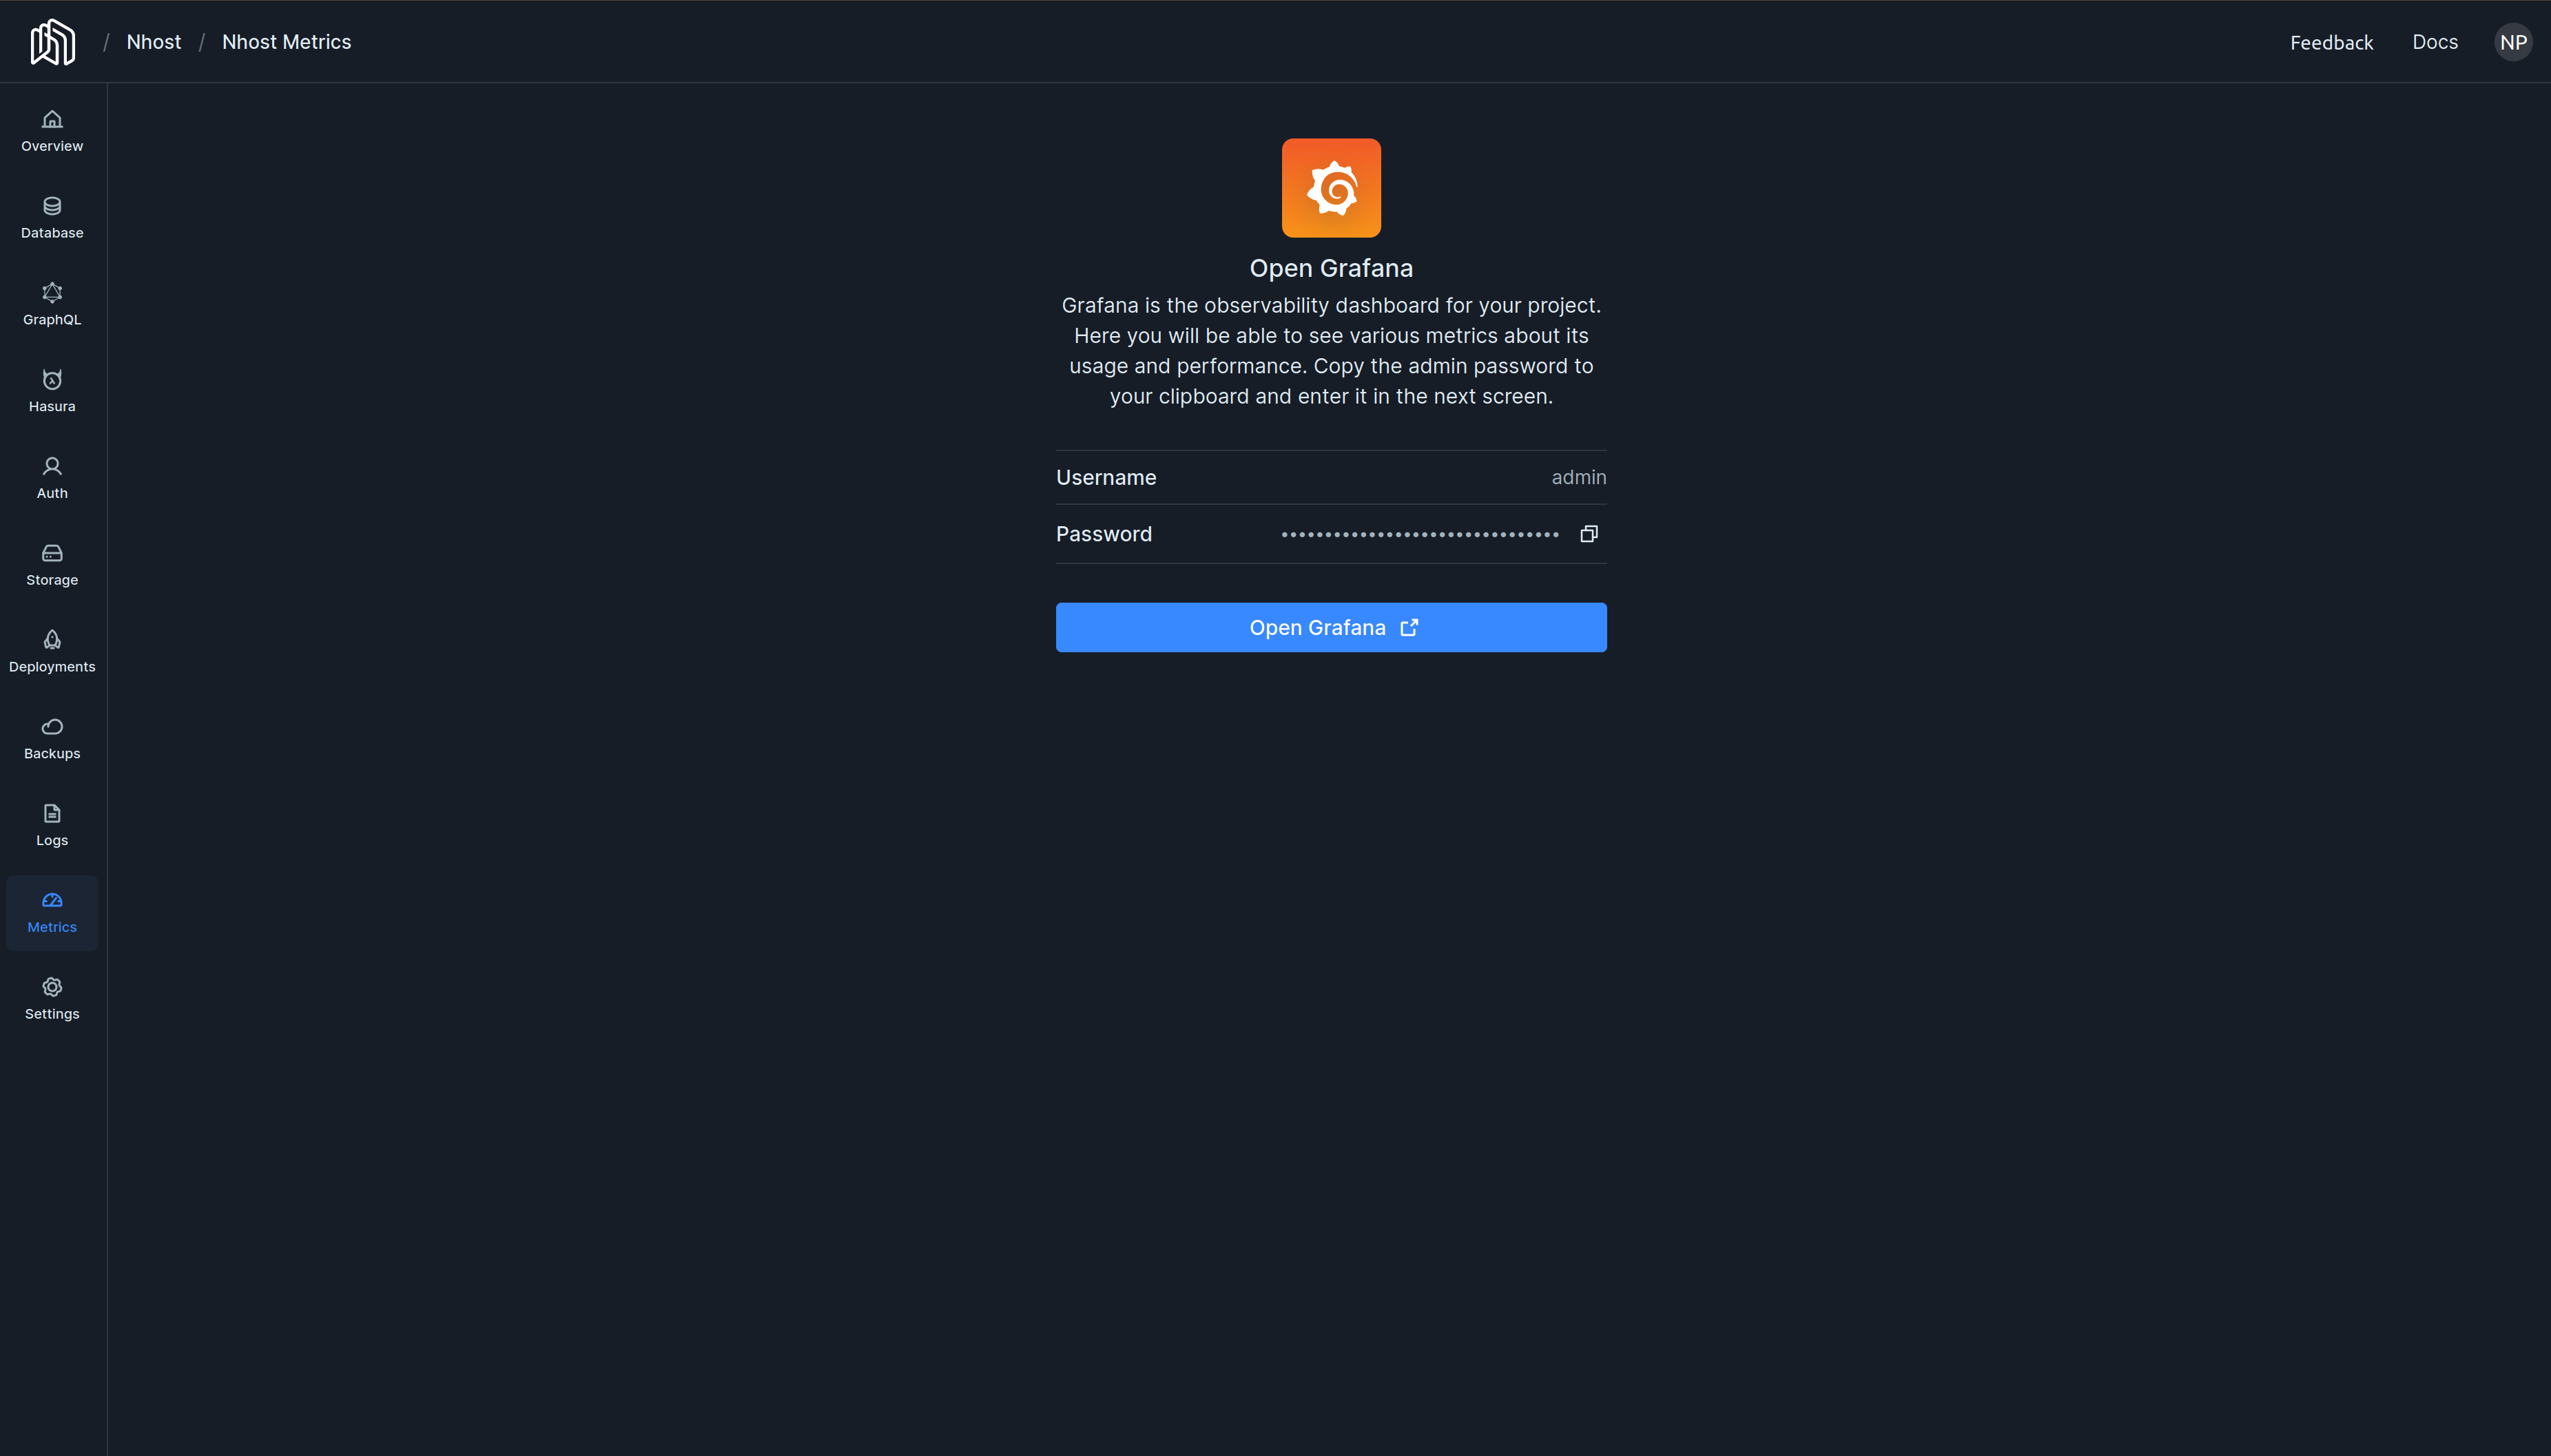
Beta
Metrics is in beta, its functionality and pricing might change.Limitations
- Dashboards can be updated or created, but they won’t persist after a deployment.